

Introduction
CloudHealth is the best product available to manage and optimize your cloud spend and vROps is the best tool to monitor and optimize the Cloud. This article will go into the technical details of how to integrate CloudHealth into vROps. Later Anthony Poh (CloudHealth Senior TAM) will write a second post which will show you what the things in this post look like in the CloudHealth UI itself.
CloudHealth
If you are running workloads and services in the cloud and you want to optimize your cloud spend, CloudHealth is the way to go! A couple of CloudHealth features you definitely have to look into are: Perspectives, Reporting & Dashboards, Integrations, Governance and Security.
Integration with vROps
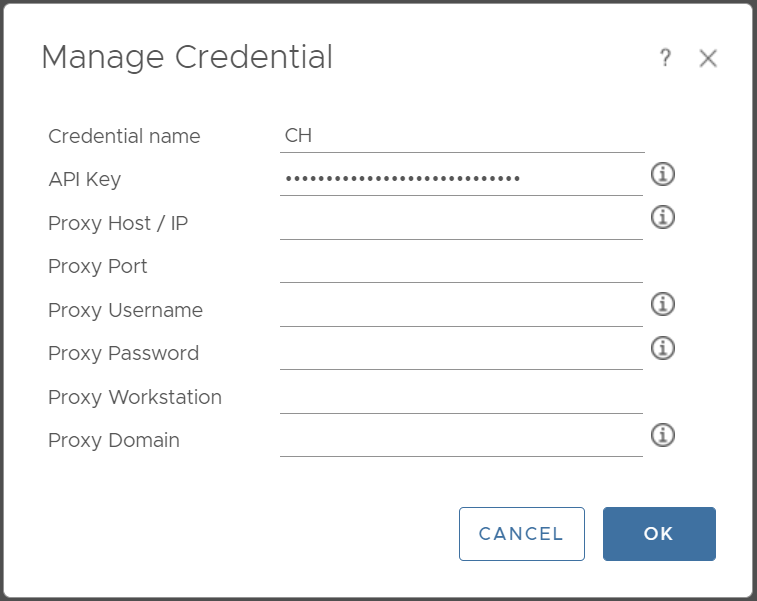
Before you can configure the CloudHealth you must generate an API Key from the CloudHealth UI. This key will then be used to enter into the credentials for the CloudHealth Adapter.
Oh, internet connectivity from vROps to CloudHealth is required. Just make sure ALL nodes in your analytical cluster can reach CloudHealth.
During the initial setup, Anthony Poh , James Kilby and myself had a problem connecting to CloudHealth. Yes, it was a DNS issue, but also a gateway issue. One of the gateways I am using in my lab does not allow internet connectivity. Guess which gateway my vROps appliances were set to use. Exactly, the one not allowing internet access.
Here is an article which explains how to make network changes on your vROps appliances.
After verifying this, the integration of vROps with CloudHealth itself is a piece of cake. Just install the vROps management pack for CloudHealth and configure it.
The why
We can see a few use cases why you might want to integrate CloudHealth into vROps. Here are two:
- Administrators must have a single pane of glass to keep an eye on ‘data center and cloud operations‘ and ‘data center and cloud spend‘.
- You want to minimize the amount of direct integrations with your ITSM and have decided that for operations and cloud vROps will be used.
Creating alerts for MTD cloud spend in vROps
One of the amazing things in CloudHealth is how you can track cloud costs and cloud spend by month to date. In vROps you can easily create alerts for this and there are at least two easy ways to do this.
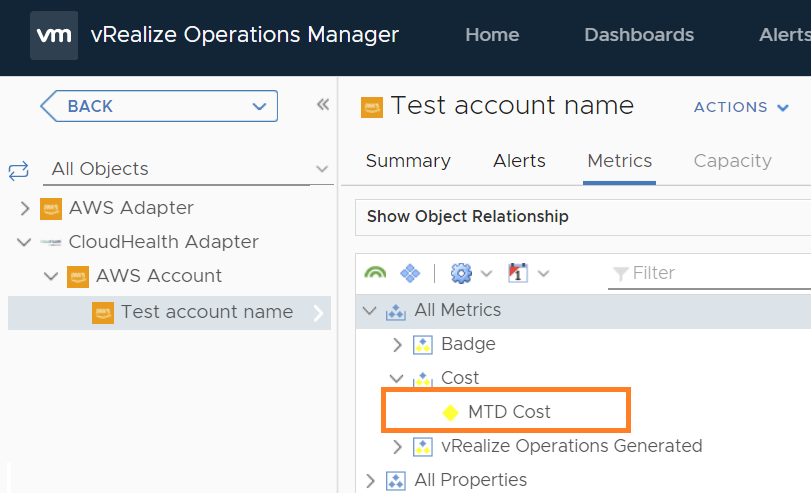
Looking at the ‘AWS account‘, ‘Region Account‘ and ‘Service Account‘, you will see that the ‘MTD cost ‘ metric is available for all objects in these Account types. So this is something we can use!
1. Create an alert for all objects in an
account group, such as AWS Cloud Accounts.
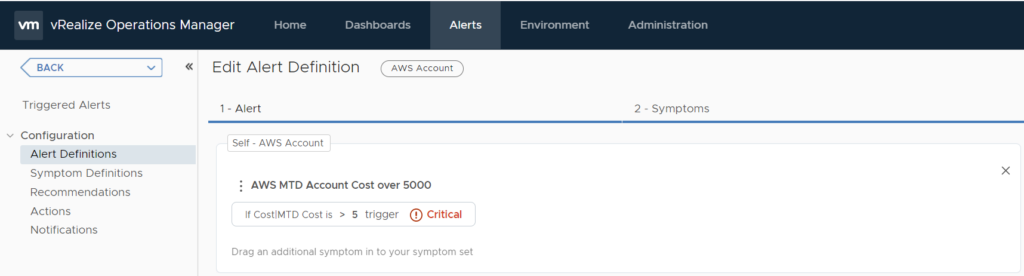
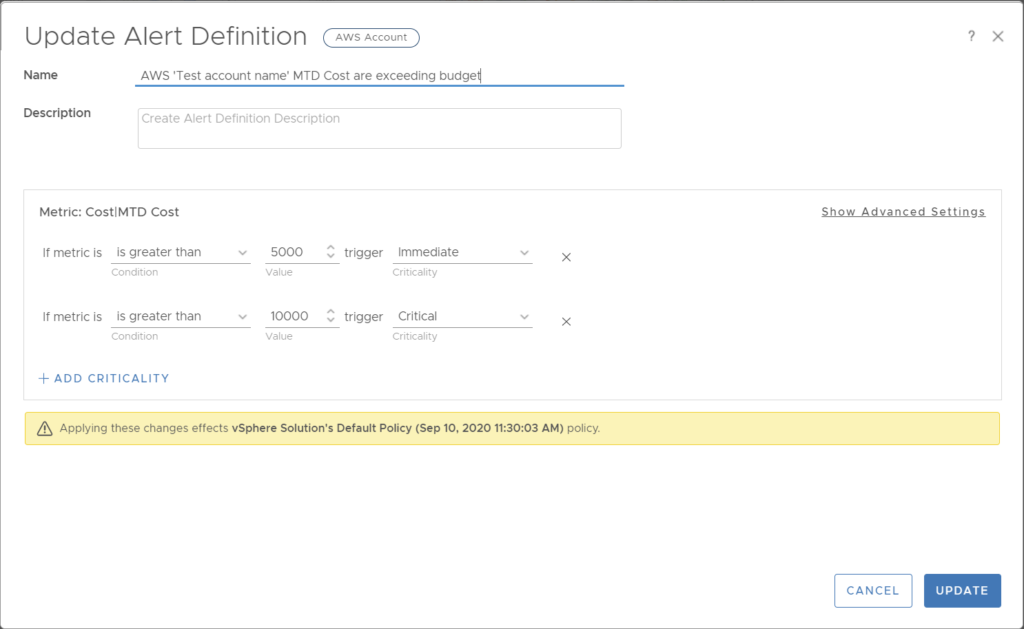
The easiest way to create an alert for a fixed MTD spend for all accounts is to create a new symptom definition and alert definition. from the ‘Alerts‘ tab.
However, when you create a new alert from the alerts tab, this alert will be triggered for each object in an account group. You do not get to select a subset of accounts or users from here. The same applies for the metric. The metric value you set, will apply for the alert across all accounts in the account group.
2. Create an alert for a single object in an account, service or region group, such as the ‘Test account name‘.
Open ‘Environment‘
Open ‘All Objects‘ and browse to the object in the group you want to create an alert for. In our case this is ‘Test account name‘
Double click on the ‘MTD Cost‘ metric, then click to edit the diagram and select to ‘create an alert definition’. This will create the symptom definition and alert definition for this specific object in the ‘AWS Account‘ objects.
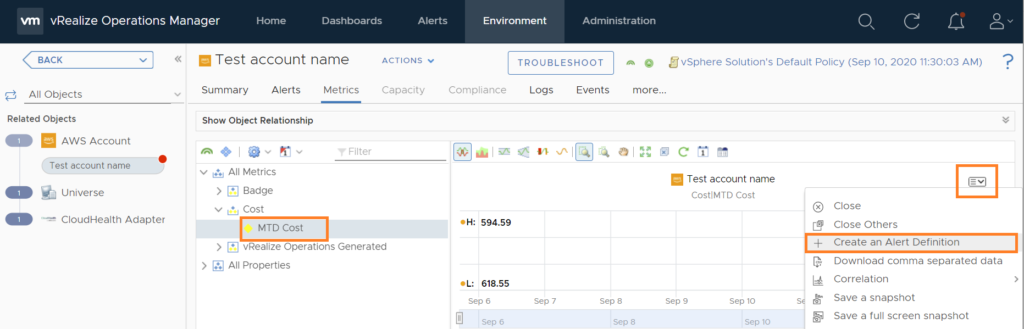
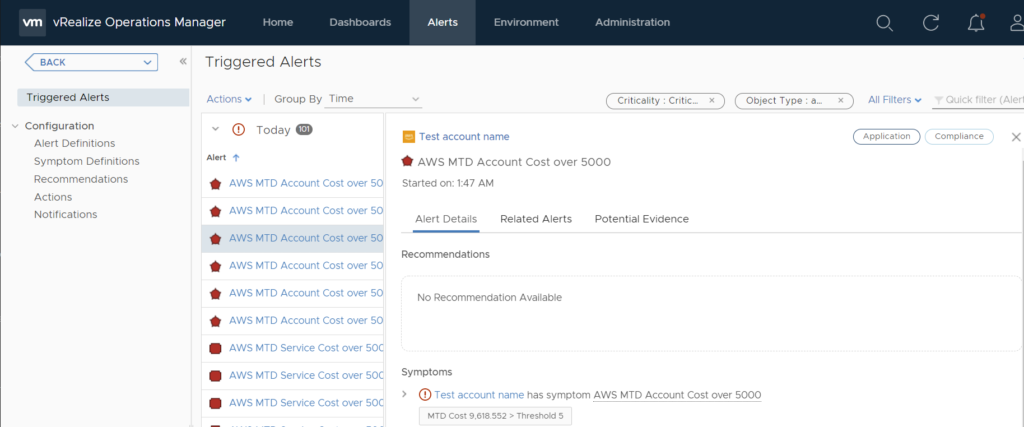
This alert will only apply to this specific object,
‘Test account name‘, and will not apply to the other accounts (in this example to the other accounts in ‘AWS Accounts‘).
Creating an alert for MTD cloud spend in vROps for an AWS Service
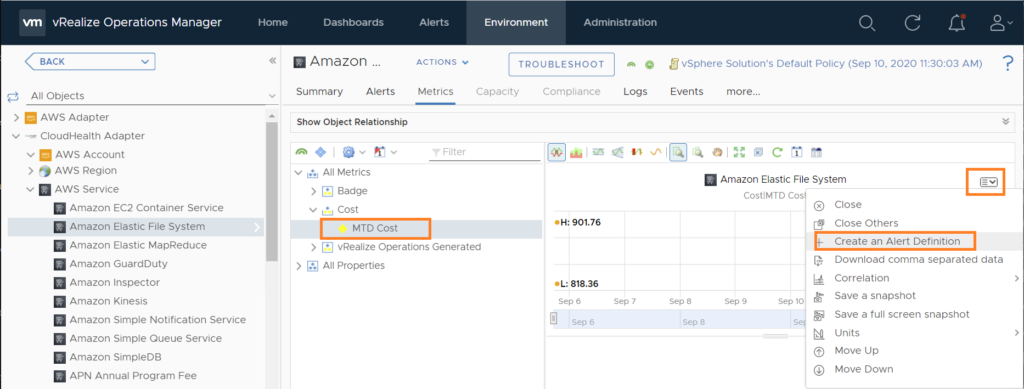
Open ‘Environment‘
Open ‘All Objects‘ and browse to the object in the group you want to create an alert for. In our case this is the ‘Amazon Elastic File System‘ object under ‘AWS Service‘
Double click on the ‘MTD Cost‘ metric, then click to edit the diagram and select to ‘create an alert definition’. This will create the symptom definition and alert definition for this specific object in the ‘AWS Service‘ objects.
Something about Perspectives and Perspective Groups
When you open the ‘all objects‘ from the ‘Environment‘ tab and you drill down into the ‘CloudHealth Adapter‘ to take a look at the available perspectives, you will see that ‘Perspectives‘ are not directly attached to the ‘Perspective Groups‘. Drilling down into ‘Perspectives‘ doesn’t really tell you how it relates to the ‘Perspective Groups‘.
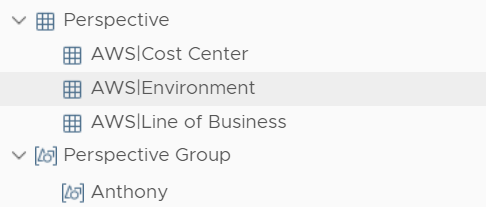
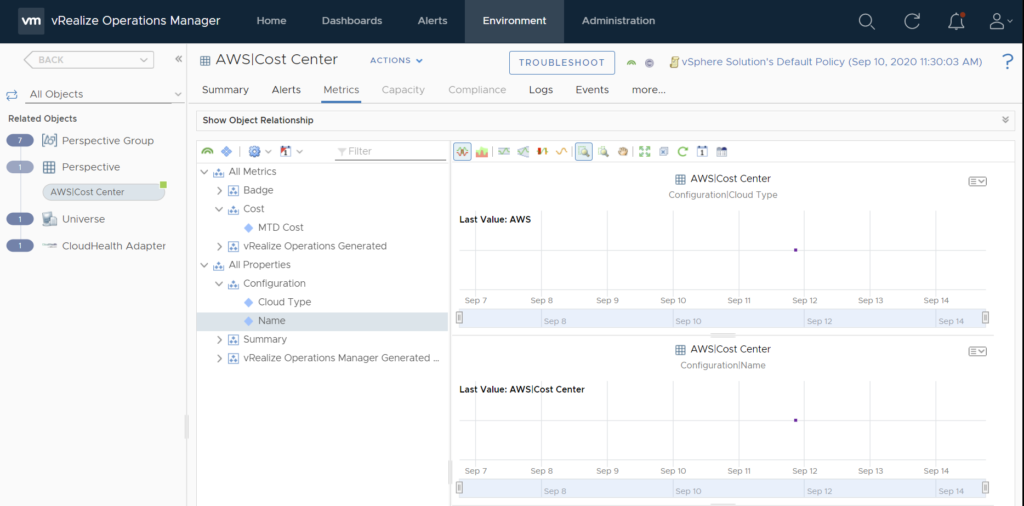
If you are used to working with CloudHealth, you know that this does not really represent the CloudHealth UI point of view. In CloudHealth both of these are tightly interwoven.
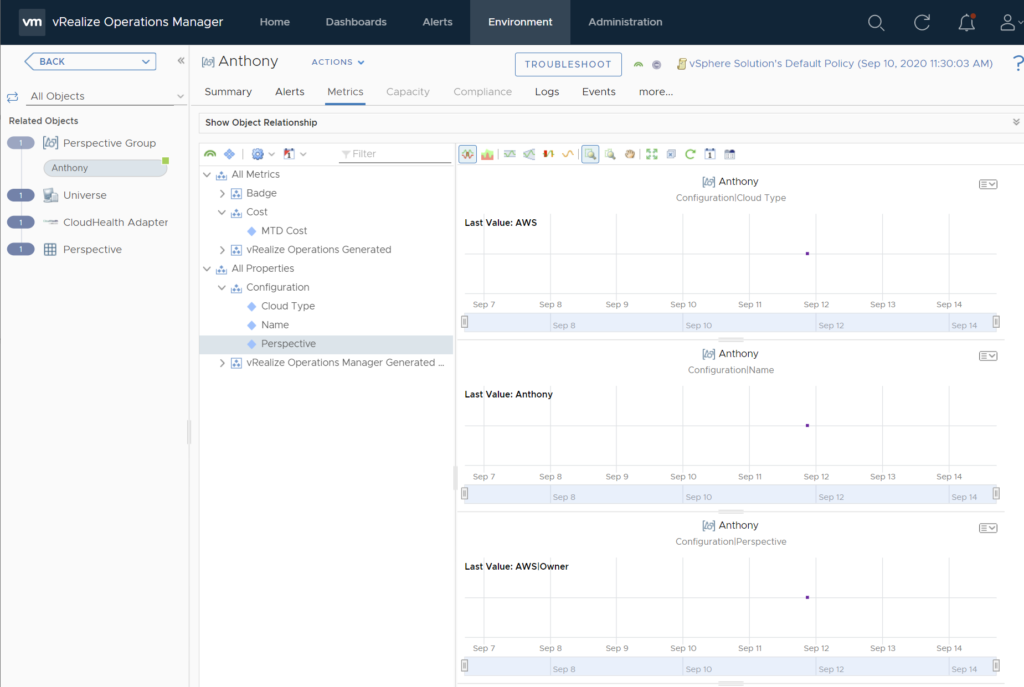
But there is a way to look at ‘Perspectives‘ from an angle that represents more closely on how CloudHealth looks at Perspectives. Drill down into an ‘object’ from the ‘Perspective groups‘, such as a username, and you can see to which ‘Perspective‘ the user has been added.
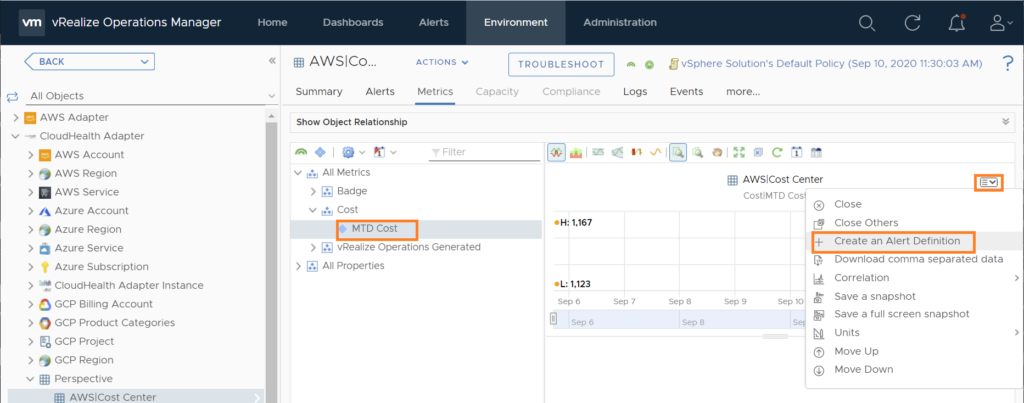
Creating an alert for MTD cloud spend in vROps for a CloudHealth Perspective
Open ‘Environment‘
Open ‘All Objects‘ and browse to ‘Perspective‘ and select the object in the group you want to create an alert for. In our case this is the ‘AWS| Cost Center‘ .
Double click on the ‘MTD Cost‘ metric, then click to edit the diagram and select to ‘create an alert definition’. This will create the symptom definition and alert definition for this specific object in the ‘Perspective’ objects.
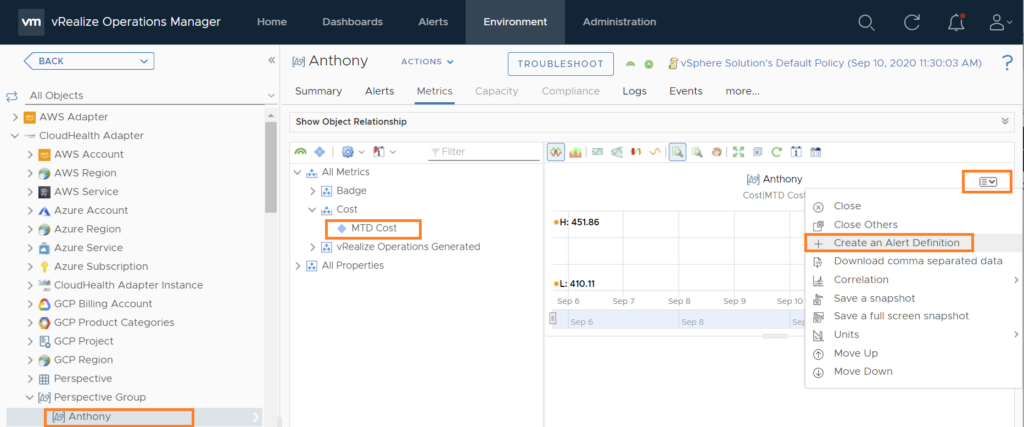
Creating an alert for MTD cloud spend in vROps for a specific user
Open ‘Environment‘
Open ‘All Objects‘ and browse to ‘Perspective Group’ and select the object in the group you want to create an alert for. In our case this is the ‘Anthony’ user .
Double click on the ‘MTD Cost‘ metric, then click to edit the diagram and select to ‘create an alert definition’. This will create the symptom definition and alert definition for this specific object in the ‘Perspective Group‘ objects.
Dashboard cloud spend by Line of Business
As you have seen so far, we are able to create alarms for every object which is available through the CloudHealth adapter.
The same metrics and properties allows us to create some pretty cool dashboards in vROps.
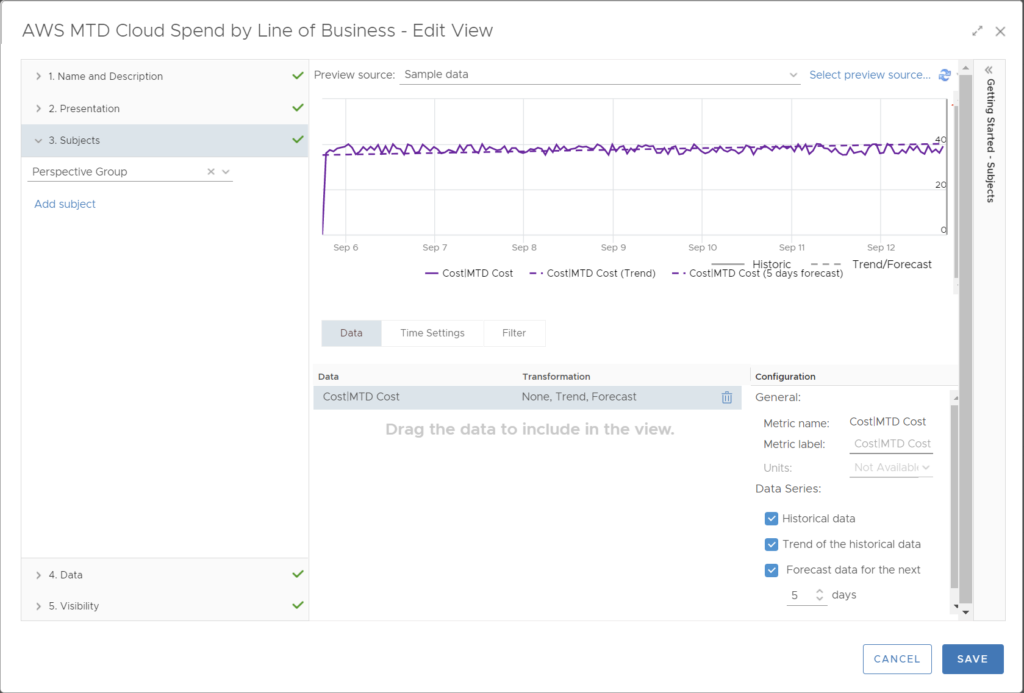
Here is an example to display the cloud spend by ‘Line of Business‘.
Create a view and set the subjects to ‘Perspective Group‘ and data to ‘MTD Costs‘.
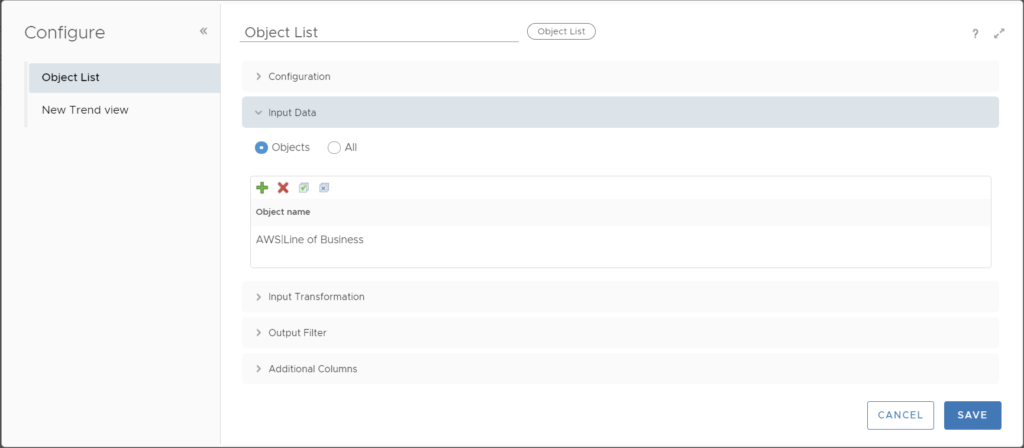
Now create dashboard where the Input Data is ‘AWS|Line of Business‘
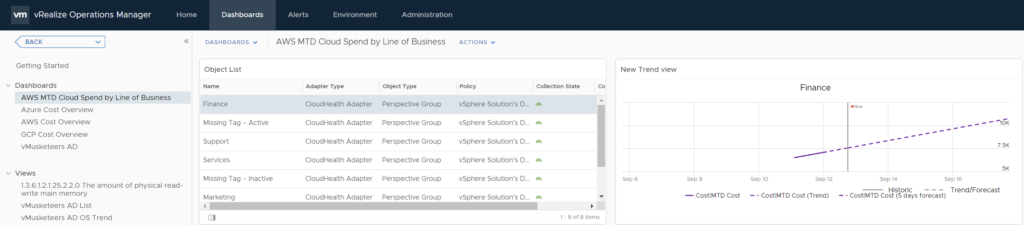
This is the result:
Kim
Leave a Reply